Highlighting a Few New Features that Help You Discover Better Designs, Faster
Often, improvements to the simplest things can have a big impact on your daily tasks. There are many tasks we perform repeatedly when working with HEEDS, and streamlining those saves time and reduces effort. HEEDS 2015.11 contains many enhancements focused on simplifying workflows and I want to highlight a few that help in exploring design performance relationships.
To explore relationships between variables and responses in detail, you typically require multiple plots of the same type, but with different variables to gain a clearer understanding of dependency or influence. However, there are many plot features that are tailored to suit the particular way you want to view the results such as axis scales, data symbols, curves styles, title fonts, and so on.
To avoid having to create a new plot from scratch and redefine all these settings, you can now right click and select the Copy Plot option. This makes an exact copy of the existing plot, with all the customization. You then just need to alter the variables or responses being displayed saving a lot of setup time.
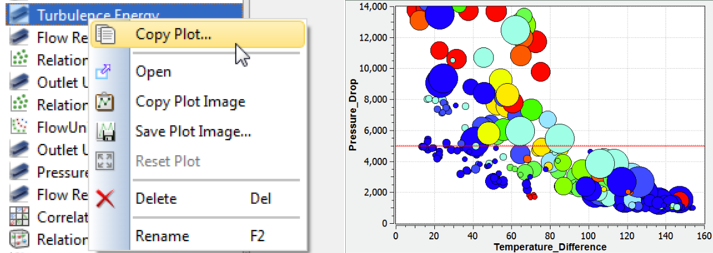
Figure 1. Make a copy of an existing plot with a single right click option
When there are a large number of plots in a study, locating the correct plot to view can be challenging. In HEEDS 2015.11, you can now adjust the plot order by simply dragging plots in the tree to the desired location. This allows you to group the plots in any order you desire so that the navigation and structure is streamlined.
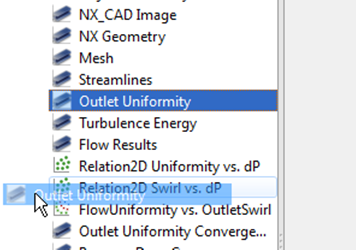
Figure 2. Drag and drop plots in the tree to group them any way want
And lastly, sometimes the easiest way to understand relationships is to view designs in 3D plots that display each design in terms of three characteristic variables. This has been possible for quite some time in HEEDS. But the latest release adds the ability to hover over any of the designs depicted in the 3D plot and overlay an image and information about that particular design (see Figure 3). This can provide tremendous insight into what variables are driving top performance.

Figure 3. Hover over any design in a 3D plot to see distinguishing design details
These are just 3 of many new features in HEEDS 2015.11 designed to help you focus on finding better design, faster. To discover more great new features, take a look at the 2015.11 release notes on the customer portal or contact your HEEDS account manager.