There are a lot of great tools in HEEDS to help you gain insight into finding the best design. One area of enhancements in HEEDS 2015.11 focused on parallel plots. In this article, we’ll highlight some ways to use new features of parallel plots in HEEDS to discover better designs, faster.
Parallel plot background
To help show the new capabilities in the context of an engineering problem, let’s look at exploring shape options for a human powered vehicle. There are obviously many dimensions that can be adjusted to improve the design.
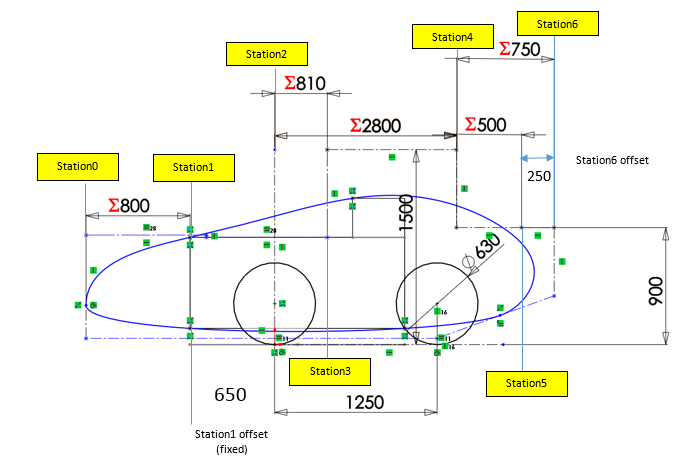
Figure 1. Possible parameters to change for a Human Powered Vehicle
A Pareto design exploration study is being used to examine the tradeoff between minimizing downforce and drag.
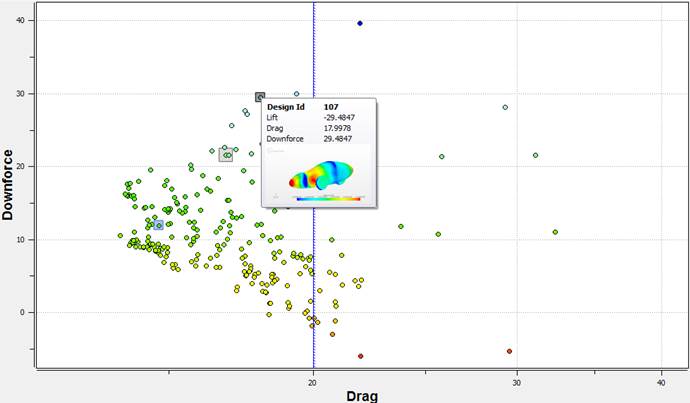
Figure 2. Pareto plot of Downforce vs. Drag
While Parallel Plots may look confusing at first glance, they provide greater understanding of design dependencies between variables, constraints, and performance goals.
Each design evaluation generates a line that links the specific variables and responses used for that design variant. Overlaying these lines for the feasible solutions can highlight common paths or parameter values that meet performance requirements.
Dark gray line = baseline design
Blue lines = feasible designs explored
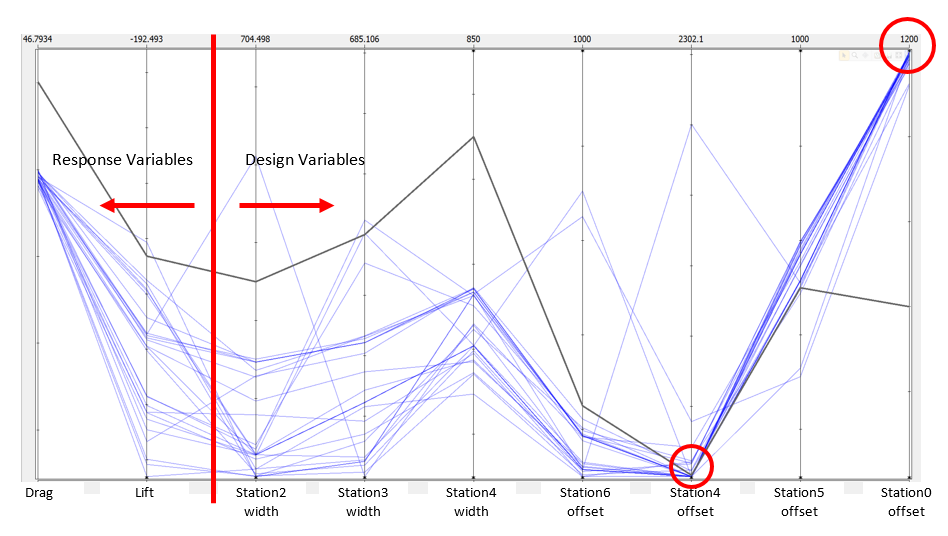
Figure 3. Top 25 HEEDS results compared to baseline design
The banding of lines can also indicate result sensitivity. For example, if there is only a narrow band of lines for a given parameter, then that parameter significantly affects performance and should be held to tight tolerance to yield desired performance. Conversely if there is a wide band, then it may have little influence. So in the above image, the resulting drag range is fairly small, but lift/downforce can vary significantly for the top performing designs.
When the narrow results bands are at an extreme end of a variable range, it indicates the potential of better solutions if the variable range is adjusted. The offset at Station 4 and Station 0 suggest there may better solutions outside the tested range.
What’s New
The new interactive capabilities in 2015.11 make it even easier to interpret design parameter relationships. Parallel plots now support:
- Adjusting the horizontal scale of the plot
- Zoom and Pan on individual parameter scales
- Filter designs based on a specific parameter ranges
- Design Set Fill Plot.
Previously with large numbers of design variables, results needed to be split over multiple plots to make viewing clearer. Now with the ability to adjust the column width and pan left or right, parameter contributions/dependencies can be clearly viewed in just a single plot, thereby saving time and eliminating duplication of effort.
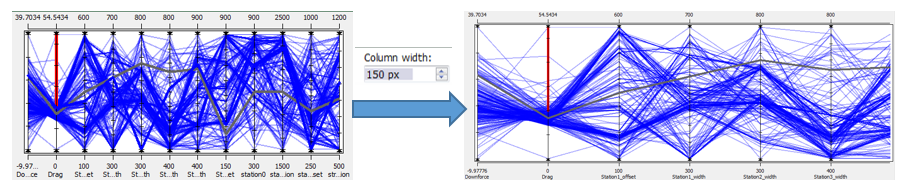
Figure 4. Parallel Plot Adjustable Column Width
Using the mouse wheel while hovering over an axis provides the ability to modify the scale by zooming in and out. Pan control is now consistent with other plots so that holding Alt key allows you to pan up and down a particular axis. This greatly assists in focusing on specific ranges of key parameters.
Axis filter ranges have been added to provide greater contrast for specifc parameter ranges. Simply by dragging the filter handles allows you to adjust what plot lines become greyed out. In this example, we can filter the drag to below 15N. This provide a much clearer view of the parameters that generate the lowest drag solutions.
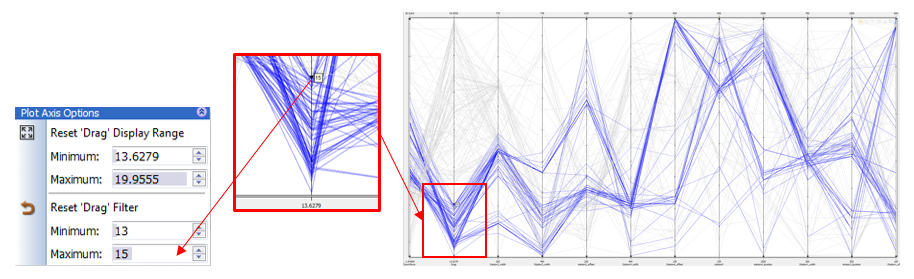
Figure 5. Column Filter Ranges
The right mouse contextual menus make it easy to reset the axis as needed.
Comparing different design sets is an integral part of parallel plots, whether it is finding common aspects of error designs or the best designs. To help in identifying these trends, the fill plot capability shows what range of performance is delivered by what range of variables for specific design sets.
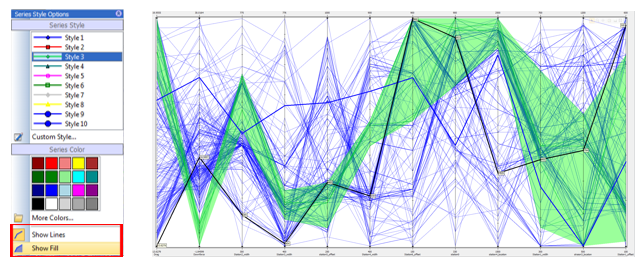
Figure 6. Design Set Fill Control
In this article, we have discussed how Parallel Plots can be used to gain greater understanding of design variable dependency and how this is even easier in HEEDS 2015.11. If you are not already taking advantage of Parallel Plots, it is well worth taking a look and seeing how they can help you in finding better designs, faster.