Design sensitivities are a measure of how much an objective or constraint response varies due to a small change in a design variable. Based on this definition, they are sometimes referred to as sensitivity derivatives. Let’s discuss how to use them properly, as well as how not to use them.
First, note that the design sensitivities we refer to here are calculated for a particular design, not for a design space. Statistical methods of sensitivity analysis can provide useful information about a design space, but not the type of information we seek here.
Since a design represents a point in the design space, it is clear that sensitivities are defined at a point, as are mathematical derivatives. Two distinct designs within a design space will probably have different sensitivities unless the design space is linear, which is seldom the case for engineering problems.
Among other uses, design sensitivities can be used near the end of a design study to increase the quality and decrease the cost of designs. If a design is found to be very sensitive to the value of a design variable, then the manufacturing tolerance on that variable can be kept tighter to ensure consistent quality in the final product. On the other hand, if it is known that a design is relatively insensitive to a design variable, then the tolerance on that parameter can be relaxed to reduce cost. The importance of calculating sensitivities of a final design candidate prior to manufacture should be clear, as there is still a strong opportunity to increase quality and reduce cost.
But there are also some unwise applications of design sensitivities. Consider the fairly common practice of calculating sensitivity derivatives at the baseline design point prior to a design exploration study. Typically, the goal of doing this is to filter out those variables that seem to have little effect on the design, so only the most important variables are considered in the search.
This may seem like a good idea, but in fact it is very risky. While a certain group of variables may have a dominant influence within a small neighborhood around the baseline design, other design variables may be needed to guide the search to a better design outside of that neighborhood. Ignoring these other variables may lead to suboptimal solutions, which can be very costly in terms of unattained design improvement. Unfortunately, there is no way to know this ahead of time.
Unless we really are seeking only incremental changes to a design, the practice of filtering design variables prior to design space exploration is not recommended. After all, we really don’t care about the sensitivity derivatives of the baseline design, and the significant effort required to calculate them is probably better spent on the design space search.
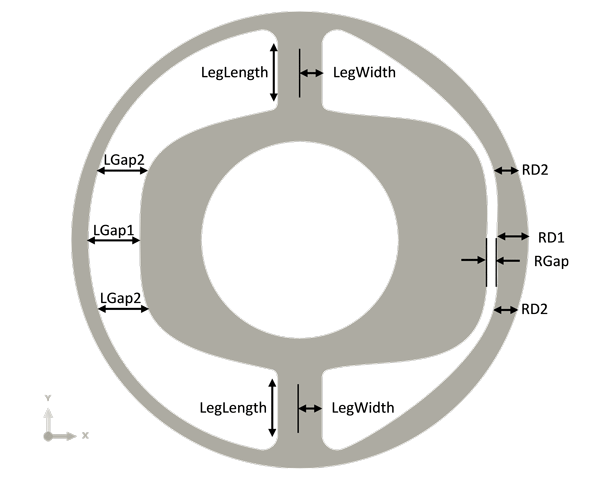
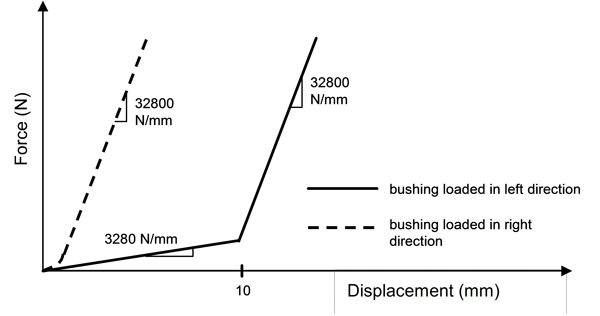
Let’s consider an example. A rubber bushing, shown in Figure 1, is encased in steel and has a steel shaft through its center hole that moves to the left and right. The rubber bushing is to be designed such that its response to prescribed loads matches two force-deflection curves, one in each of the two primary loading directions. The target force-deflection curves are bilinear, as shown in Figure 2.
The optimization statement is:
Objective: Minimize the root mean square error (RMSE) between the actual load-deflection curve and the target load-deflection curve
Variables: shape parameters (see Figure 1):
LGap1, LGap2, RGap, RD1, RD2, LegWidth, LegLength
Each potential design was analyzed using ABAQUS/Standard, and the analysis included geometric nonlinearity (large strains), material nonlinearity (rubber material response) and contact at the boundaries.
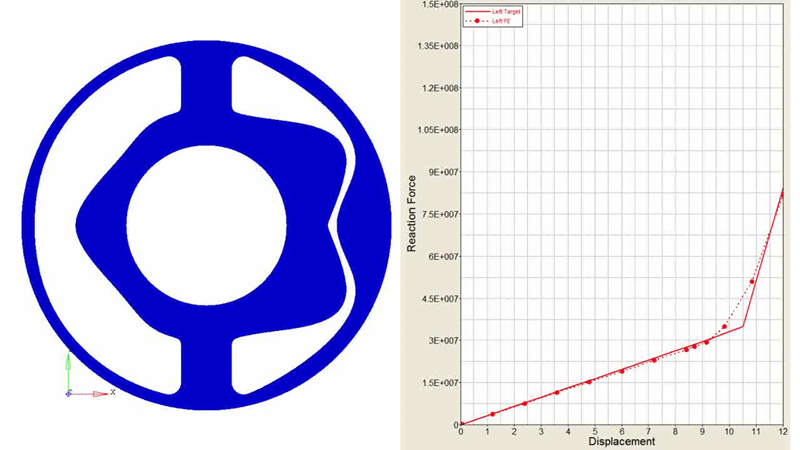
For the current discussion, we are not concerned with the details of the design exploration study, so we will skip straight to the results. The best design found and its performance are shown in Figure 3.
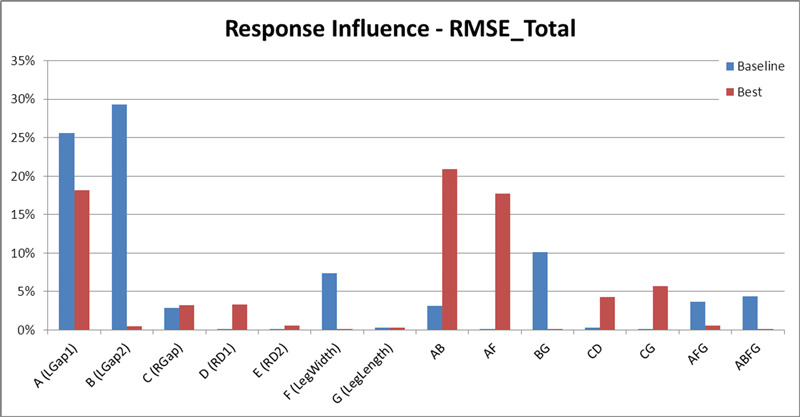
The design sensitivities of both the baseline design and the final design were calculated. Then, the percentage contribution of each variable to the RMSE response was plotted, as shown in Figure 4. This is often referred to as a pareto chart. It provides a convenient way to visually see which variables have the most influence on the design behavior.
For the best design found, the results in Figure 4 indicate that the RMSE is most sensitive to LGap1, so we should maintain a strict tolerance on this variable to ensure high quality designs. In addition, the interactions between LGap1 and LGap2 (AB) and between LGap1 and LegWidth (AF) are also strong, so we must pay attention to the values of LGap2 and LegWidth as well.
The results in Figure 4 also illustrate that the design sensitivities of the baseline design and the best design are very different in many ways. For example, the baseline design is very sensitive to the LGap2 variable. But the best design shows almost no influence due to the value of LGap2, even though the interaction between LGap2 and LGap1 is relatively strong. Note the other differences between the designs in Figure 4.

Figure 3. Best design found and its corresponding performance in matching the target force-displacement curve when moving to the left.

Figure 4. Percentage contribution of each variable to the RMSE response for both the baseline design (blue) and the best design (red).
This example illustrates the proper use of design sensitivities for maintaining quality and reducing cost. It also demonstrates that design sensitivities can be very different from design to design.
In general, it is not advised to calculate sensitivities at the beginning of a design study, and it is very risky to filter out design variables based on sensitivities of the baseline design. Doing so will often lead to sub-optimal designs being found during the design space exploration.
We hope this tip helps you to find better designs, faster.

